|
|
Graham K. Rogers
One of the features of utilities and the System Preferences in OS X is that they use the advanced facilities available in the Unix installation that runs beneath OS X, but are covered with a pretty graphic ingterface, so that we do not have to get our hands dirty at the command line. As an example, we looked recently at Balthisar Tidy, a cleanup utility for HTML pages that builds on "tidy" which is part of BSD Unix available with the BASH shell (default with OS X).
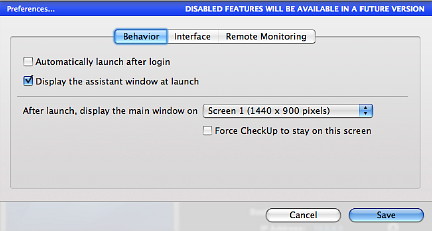
The intention is to give a user a complete graphical overview of what the system is and does. On the whole, its good looking interface does this, with a couple of minor surprises (nothing unpleasant). The utility is in an interim, pre-release stage, so some of the features are disabled (or not yet available), but these too show some interesting actions to come. It installed in the Applications folder as expected and on initial start, instead of going straight to a systems check, I opted to view the the applications preferences panel. I noted that remote monitoring was one of the features that is not available for the demo version (see below).
Switching between panels is not simply a new drop down panel appearing, but the cube effect is used, giving a heightened (visual) sophistication to the appearance.
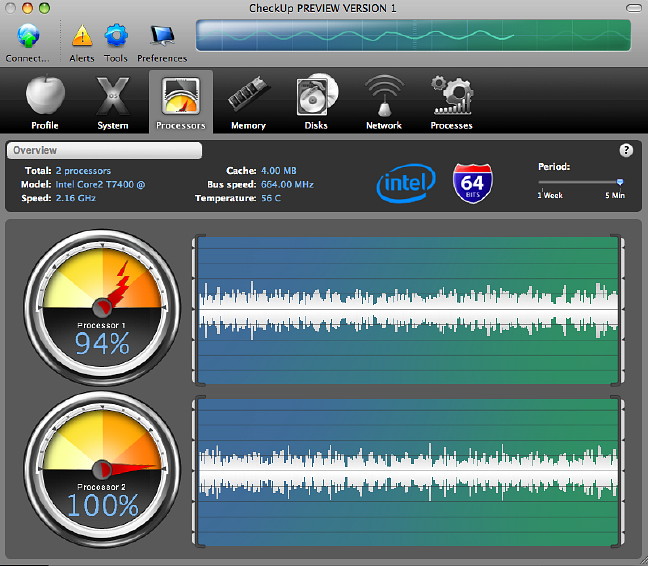
The processor panel has two main readings in the form of "speedometers" for procesor activity, and graphs. One of each for each processor. It is possible to change the graph size from a minimum 5 minutes up to 1 hour, but when there is unusual activity (I moved the mouse about a lot to change the readings), there is no accurate way to asses the exact time of the event. Simply, a few dots along the top would assist here.
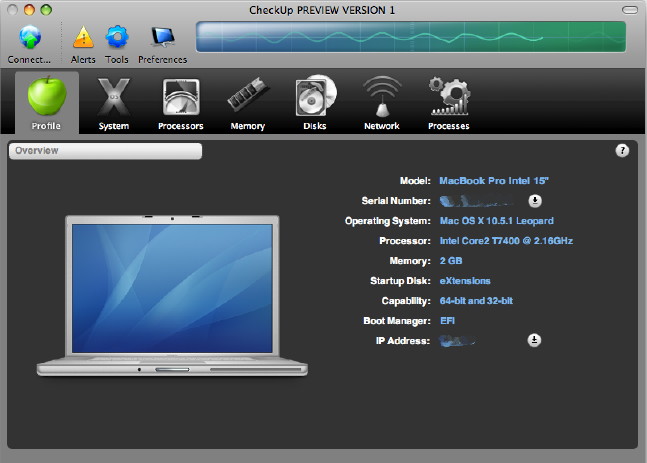
As I am testing this within hours of its arrival, I do not have access to an external disk so cannot see what readings the Disks panel might provide here. However, the panel does provide an interesting insight to the Leopard installation on this MacBookPro.
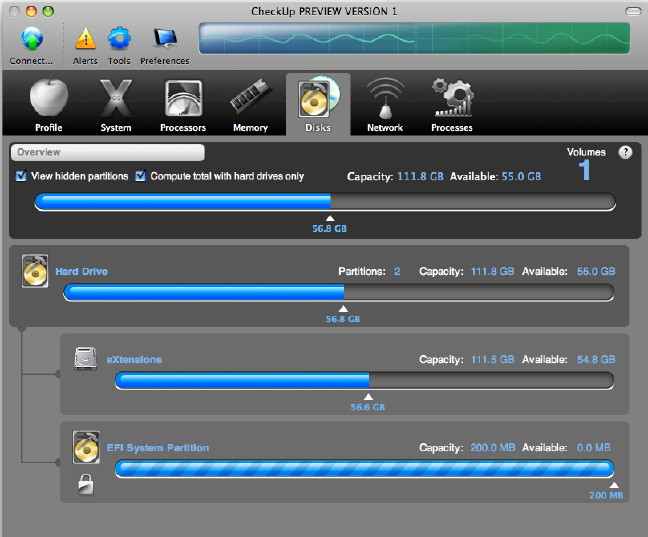
EFI is Extended (or Extensible) Firmware Interface that is a link between the firmware and the software and (for the Intel processors) is a replacement for the older BIOS on a PC or Open Firmware on PowerPCs. The Network panel gives basic information in text form concerning input and output as well as the IP number of the computer. Mine showed the link to the router but not the true IP (which iStat nano can provide). A graph displays highs and lows and (like the processor panel) can be set to any time between 5 minutes and 1 hour.
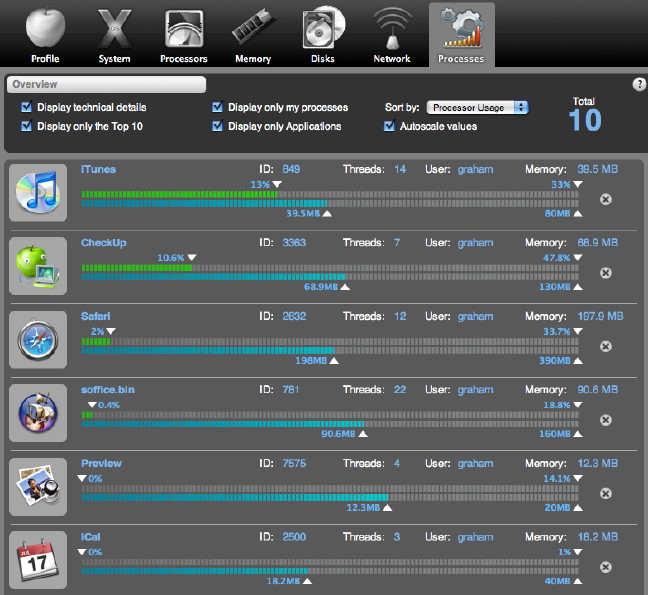
The default is to display only the top 10 processes (activity and memory) and even that list goes off the page. We can add to the information by checking "Display Technical Details" and the process ID number (the PID is useful information for sure), plus threads, User and Memory are added. To the right of each process listed is a small cross in a white circle: this enables one to force quit a renegade process and a warning panel appears to make sure that is what you really want to do. Other default settings that can be unchecked are "Display Only My Processes", "Display Only Applications" and "Autoscale Values." The first adds all processs running on the computer, including Root applications (although if Top Ten is selected this may not make much difference). The Display Only Applications box really ought to be kept checked as what appears is all of the underlying processes which may confuse many ordinary users: "genredection" and "mdworker" were two that appeared in my list using the Unix Executable icon that signifies a system process. Too much information can be dangerous. The last box was Autoscale Values and this made subtle changes to the graphing displays of each process. "Off", it compared the activity against a line of 100%. "On", the process was compared to its own maxima of activity and memory usage. This panel also has a button (top right) that allows sorting depending on different parameters. The default was the top item, Processor Usage. Also available is Memory Usage, User, PID, Process Name, and Threads.
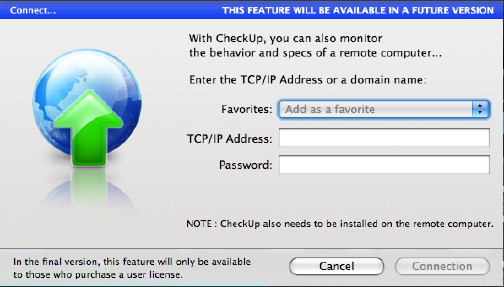
While new features of Leopard allow remote access and control of the desktop, an application like this, to help with analysis, would be of considerable value to a System Administrator when assessing problems on several machines particularly if working remotely. Likewise, the Alerts tool is currently unavailable, but itself has five sections to match the readings panels: Processor, Memory, Disks, Network and Processes.
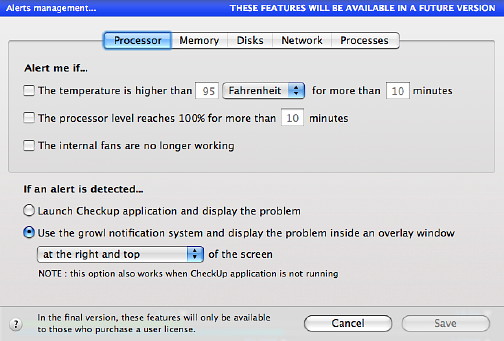
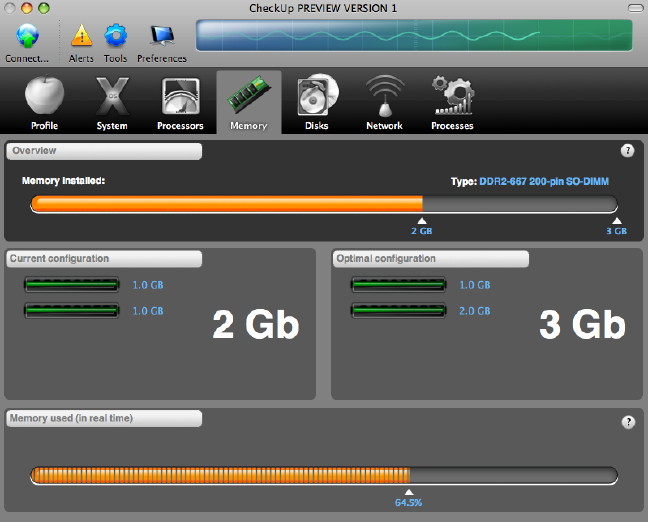
Similarly if there are memory problems, disk space is short, or the SMART status changes, there are network problems or processes become out of control, the applicationwill launch and a Growl notification will appear.
What will make the final version far more valuable is that remote monitoring facility which, if it works as intended, will give easier access to other computers that need to be checked. What this application also has in spades is style. As good as Activity Monitor is, many ordinary users are deterred by its utilitarian interface. People like me don't care about that; and if necessary I can find more information using Terminal and Unix commands. A majority of Mac users do not want that: ease of use and good design are the mantras that guide us. This application has that aplenty, although I have one or two minor reservations. These minor points include the aforementioned lack of time points on graphs, but also there is no ability to scale (or otherwise reduce the size) of the display. While Activity Monitor icons are tiny, there might be a halfway size so that more information might be displayed onscreen, particularly with the Processes panel. The final version is due for release at the end of January 2008. Currently it is in English, although French and Italian versions are planned. Right now a user licence may be ordered at a cost of $29 (until 31 December).

|
|
 A few weeks ago I signed up for a look at a new system utility that was "coming soon" with a smart new interface. I am always game for anything like this. I had email notificaton this morning (Thai time - 10 Dec.) and downloaded the software preview, called CheckUP, immediately from